Freelance data analyst


Please contact me to discuss your data requirements
As a data analyst, what can I do for you?
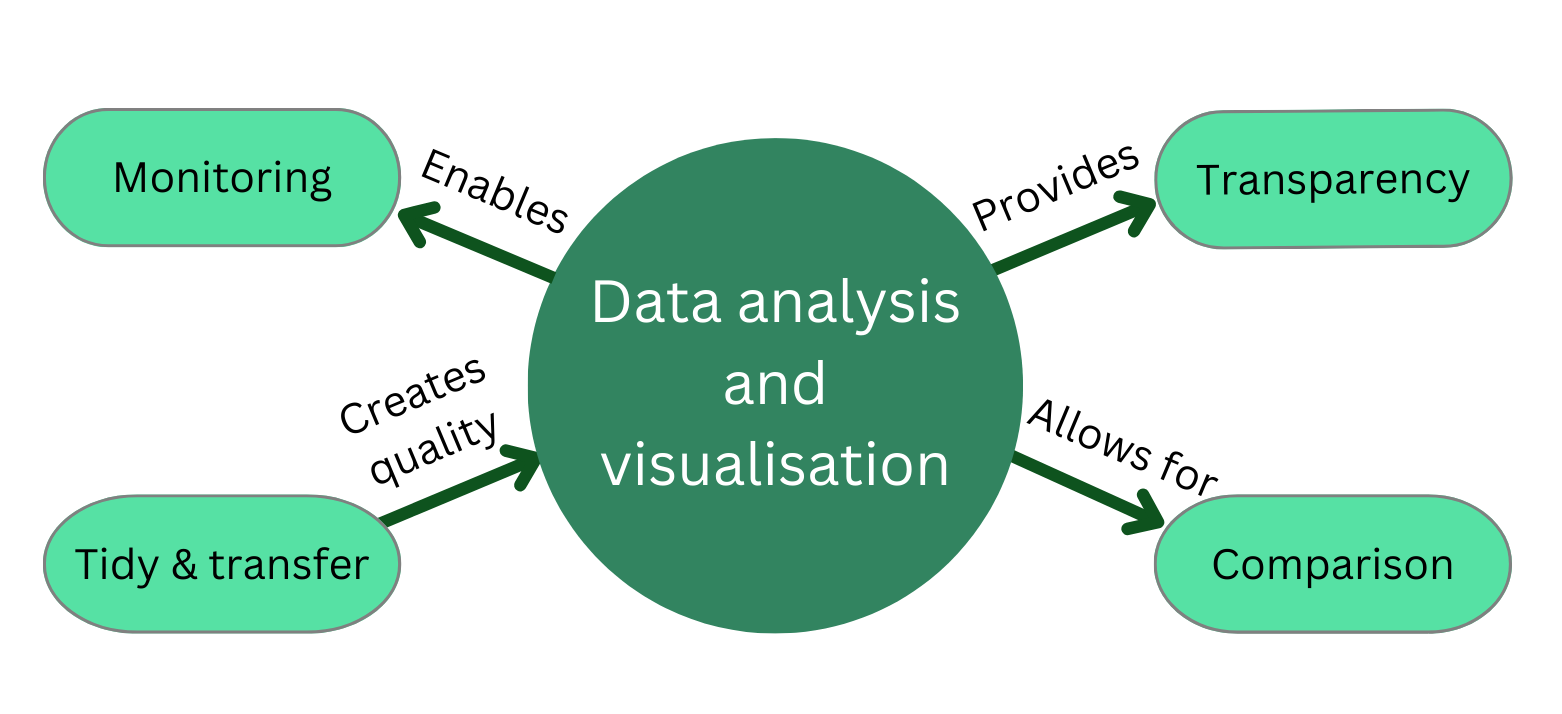
I analyse data to try to help you gain more insights and streamline processes to allow you to see information in a timely manner.
I help clients to:
- tidy up their data,
- move data to new sources,
- bring data from different sources together to provide deeper insights,
- remove unnecessary manual steps, and
- create dashboards and reports.
To do this I use a variety of tools and technologies including Power BI, SQL and R.
What type of projects can you help with?
A few examples are provided below but this list is not exhaustive.

Creating dashboards/reports to allow figures to be compared. Finance related examples include:
- comparing budgeted costs to final costs
- showing the movement in the price of items regularly required
- compare the cost of an item across finance systems to allow more reconciliation as costs flow across systems from purchase order through to eventual payment of invoice.

Creating dashboards to demonstrate that industry standards/legislative requirements are being met. Examples include:
- tracking CO2 emissions for transport,
- status of repairs required to properties for sale or lease,
- inspection status of assets, show the number of maintenance inspections compared to schedule.
- monitoring the dates and submissions of legislative reports.
- showing operational efficiencies against KPIs
- Provide reports to external monitoring bodies demonstrating legislative requirements are being met.

Creating dashboards/reports to allow more regular monitoring of specific areas. Finance related examples include:
- providing regular updates on the status of payments due to a company, highlighting those outstanding for a longer period of time to aid with debt risk management
- review of work in progress to aid with financial income forecasting
- spotting anomalies in financial reports through visualisations and alerts if certain levels exceeded
- moving from monthly downloads of excel from finance systems for reporting purposes to allowing the figures to be taken direct from the finance system into a dashboard alleviating the requirement for the downloads.

- Moving data from one location to another eg from old database (system) to new
- Cleaning the data before transfer to new database.
- Linking data from different sources into one report making the information easier to find.
- Cleaning data in existing systems to reduce anomalies and make the reporting of figures easier.
- Single source of truth. Too many systems. More to one central location, everyone working from the same base figures.
What tools do you use?
Typically I use Power BI or R Shiny to manipulate and display (visualise) the data. To do this I use various coding languages such are R, DAX, M code, SQL , HTML and CSS.
Some clients find it helpful to know what tools I use as they are looking for people with experience in this area, others find it scary as the terminology is unfamiliar to them. Please don’t let myself or anyone else scare you off from making the most out of your data through the use of terminology. In essence I just need to know what you want to do with your data and then I can discuss the tools and programming languages required.
Work on my own or as part of a team
I am happy to provide my services directly to you to help with data analysis. Perhaps you have data in an area and would like me to work with the specialists in that area to create reports, or manipulate the data to allow them to see the data output in a different way.
As a data analyst I don’t have to work alone. I can work alongside other disciplines such as data engineers, data scientists, specialists in the topic the data relates to, website or graphic designers to name but a few.
Freelancers can pool our services together. Think of refurbishing a house – you might need a plumber, electrician, joiner, decorator, etc. By pooling these trades together you can create a stunning revitalised house. Why should it be different with data, we all do different roles but at the end of the day we are contributing to the same project.
I have access to a group of freelancers who can be called up to support me on a project and equally I am happy to work as part of a team to support others.