This example using RShiny shows how to add polygons to a map from a geoJSON file to show school catchment areas. The school locations are then plotted. The geoJSON file used in this project can be found at:...
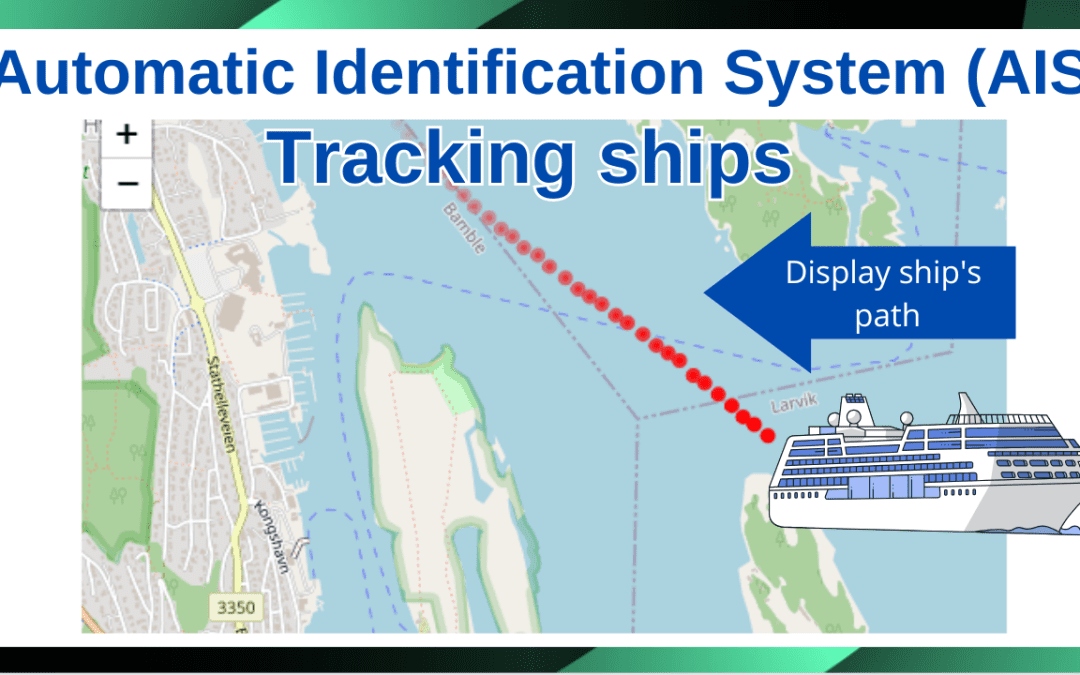
Ahoy there! Did you know that you can track the location of vessels? All you need is the AIS data transmitted by the vessel. AIS data provides a wealth of information including current location, course, and speed all of which can all be used to make waves in the field...
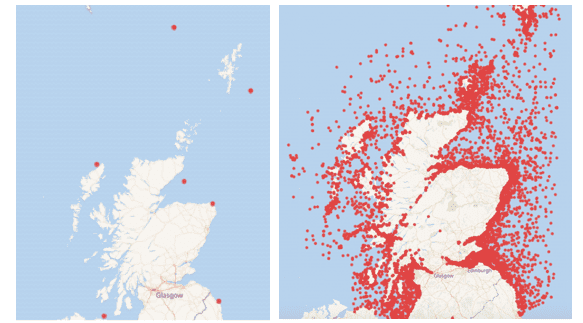
Over 23,000 ships have been wrecked off the coast of Scotland. I was astounded when I discovered that figure as it’s far higher than I would have guessed. I quickly went from being astonished to being quite sombre thinking about how many lives would have been lost at...
‘Twas the 27th November, the day after Storm Arwen. We were in our homes huddled around our computer’s discussing the effects of the storm. But we couldn’t sitting around chatting all day as we had two days of hacking ahead of us at at Code the...
This example shows how easy it is to plot items on a map using Power BI. With a few clicks data can be gathered, a map created, and markers plotted onto the map. Simple! Background The example involves using Open Data to plot monuments in Dundee (UK) onto a map using...
iframe – creates a frame on a page which contains another webpage, effectively creates a webpage within a webpage src – contains the URL of the frame to which we are linking in the other webpage, i.e. the frame in Google maps. width – specifies the width of the...
We use cookies to ensure that we give you the best experience on our website. If you continue to use this site we will assume that you are happy with it.OkNoPrivacy policy