Over 23,000 ships have been wrecked off the coast of Scotland. I was astounded when I discovered that figure as it’s far higher than I would have guessed. I quickly went from being astonished to being quite sombre thinking about how many lives would have been lost at sea.
Why am I telling you this? Well, it all came about through being a member of team Nautical Wrecks at a two day hackathon organised by Code the City.
Taking inspiration from an image on Marine Scotland’s website showing the position of shipwrecks around the coast of Scotland, our initial project idea was to create some form of information product about the shipwrecks and their location.
It quickly became apparent that creating a product was not going to be feasible as it was taking us quite a bit of time to find the data used to create the image. We eventually found a data file containing shipwreck locations on Canmore’s website. Canmore’s part of Historic Environment Scotland.
The project focused then changed and our aim became to upload the data to Wikidata to make it more widely available and searchable.
At the start of the weekend, if you did a search on Wikidata for the shipwrecks, you would have been provided with the map on the left. Due to the work done during the hackathon, and follow up work since undertaken, the map on Wikidata is now that on the right.
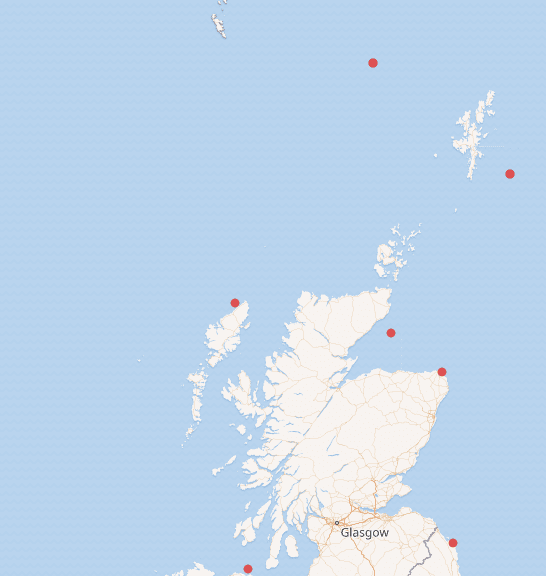
Before
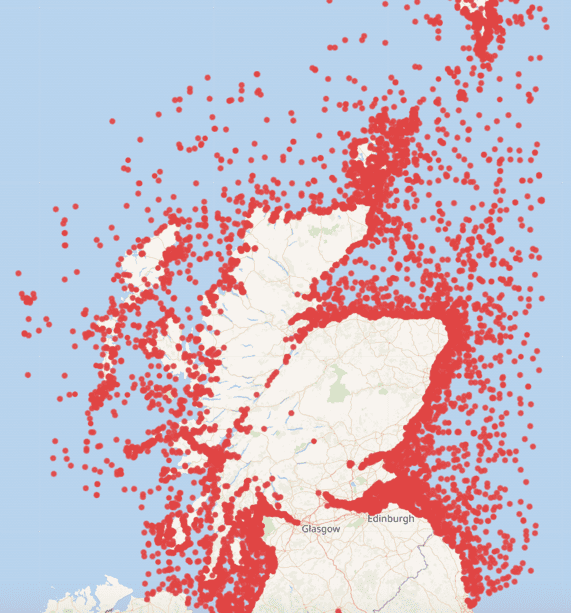
After
The locations on the map are where the ships were considered to be wrecked, therefore it doesn’t mean that anything of the ship remains there today.
Now the data is in Wikidata, what will the data be used for? I don’t know, that’s the whole point of making data open. Anyone can use the data for any purpose.
Maybe you are a teacher, and next talk like a pirate day perhaps you could get the kids to do more research on the ships. Even get an adult to upload to Wikipedia or Wikidata the research found if it’s not already there. Share the knowledge.
Or perhaps you want to just develop your data skills using a dataset, for example, some areas of the seabed are more densely populated than others. Is it obvious why? Or are you surprised by the results?
In a separate video below, I’ve provided an example showing how easy it can be to take the shipwreck data in Wikidata and use it in conjunction an esri map in Power BI or leaflet map in an R shiny app. Videos demonstrating this can be found on YouTube.
More can be done on this project and anyone is free to take it forward in anyway shape or form. If you do use the data, please let myself or Code the City know as those involved in the hackathon would be keen to hear how the data has helped you.
If using the data, remember to abide by any licensing agreements attached to it and read any terms and conditions regarding use and quality of the data.
The extended file for the Wikidata/OGA example can be found on Microsoft’s Community R Script Showcase -
Blogs providing more information:
Overview of hackathon organised by Code the City in November 2020