How to …
R Project – create line chart
Follow along practical example – In an R script upload a spreadsheet, manipulate the data by pivoting columns, and then producing a line chart with data points.
R Project – create bar chart – uses gglot2 package
Follow along practical example – In an R script upload a spreadsheet, manipulate the data by removing column/variable, change variable name, and pivot columns, and then producing a bar chart.
RShiny – add catchment areas to a map using geoJSON
This example shows how easy it is to insert Wikipedia extracts into a Power BI report using the Wikimedia API.
New user of Power BI – Navigate tables and bar charts
Are you new to using Power BI? Here are a few tips on how to navigate bar charts and tables.
Easy – Insert Wikipedia extracts into Power BI using an API
This example shows how easy it is to insert Wikipedia extracts into a Power BI report using the Wikimedia API.
Easy – Add a WikiCommons image to a web page
You want to insert an image from WikiCommons onto a web page, it’s easy. All you need to do is copy and paste one line of code into the source html file.
Easy – Plotting items on a map using Power BI
It’s easy to plot items onto a map using Power BI. With a few clicks data can be gathered, a map created, and markers plotted onto the map. Simple!
Easy – to insert a Google Map into a web page just copy and paste
It’s easy to insert a Google map into a website. These short instructions show you how to copy and paste one line of html code to create your Google map.
HTML & CSS Image Code Attributes Description
Description of HTML & CSS image code attributes
View a local web page in a browser
To view a local web page in a browser, select the file from folder in which it is saved and press open
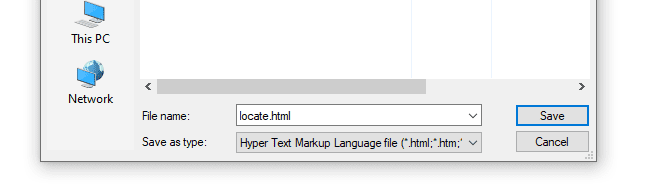
How to set up a new html page
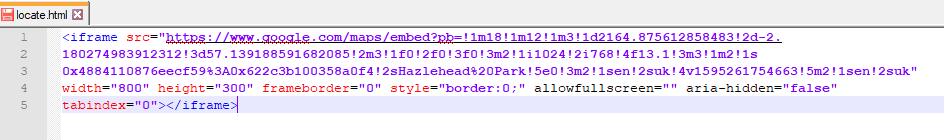
Google map html & css code attributes descriptions
Description of Google map html & css code attributes