How to Read Power BI Tables & Charts

How to Read Power BI Tables & Charts

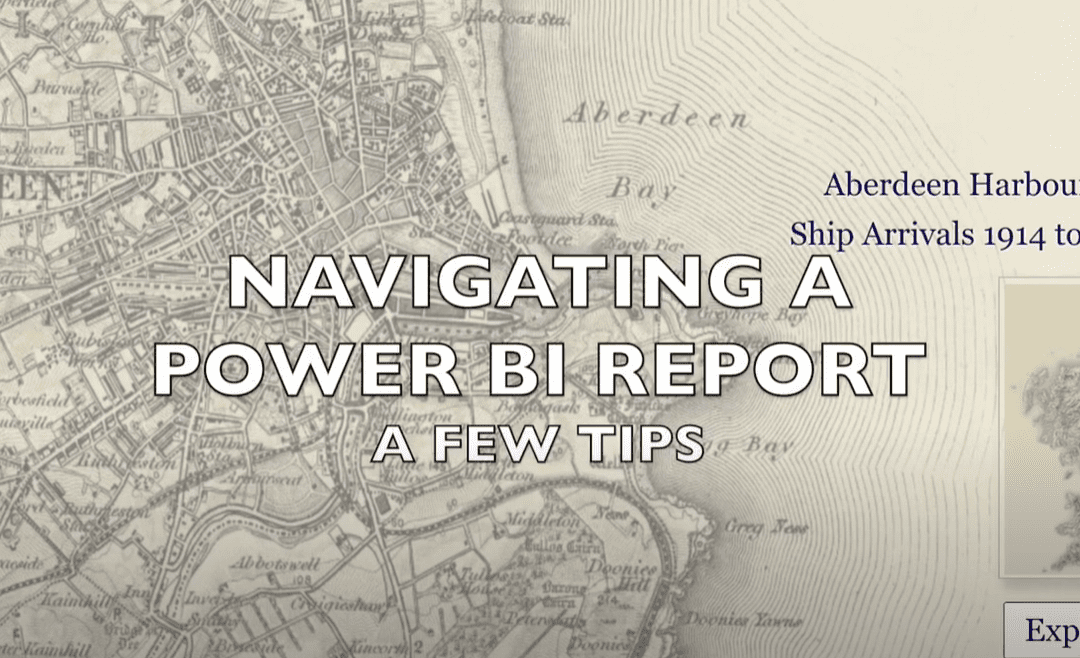
Are you new to using Power BI*? The video below provides a small introduction to navigating bar charts and tables, To explore a Power BI report, it’s all about clicking on diagrams and choosing the various options to view the data in different ways! An earlier...
Quick Guide: Wikipedia API in Power BI

Quick Guide: Wikipedia API in Power BI

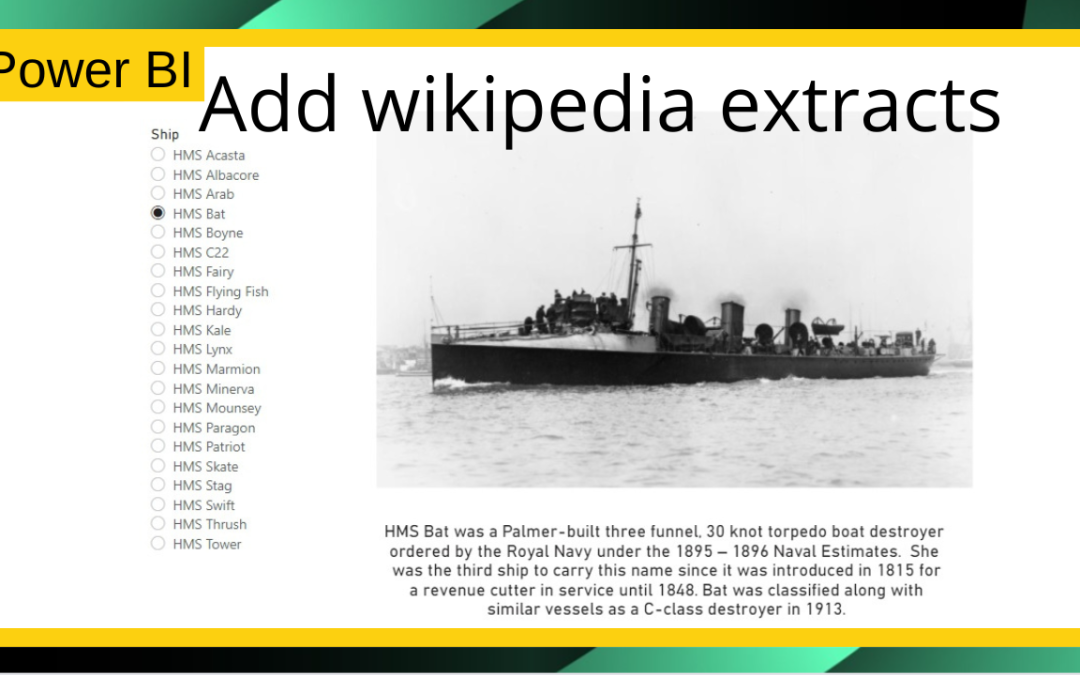
This example shows how easy it is to insert Wikipedia extracts into a Power BI report using the Wikimedia API. A slicer is created to hold the name of ships, an image of the relevant ship is pulled in from Wikimedia Commons, and an extract relating to the ship is...
Adding Wikimedia Art to Power BI

Adding Wikimedia Art to Power BI

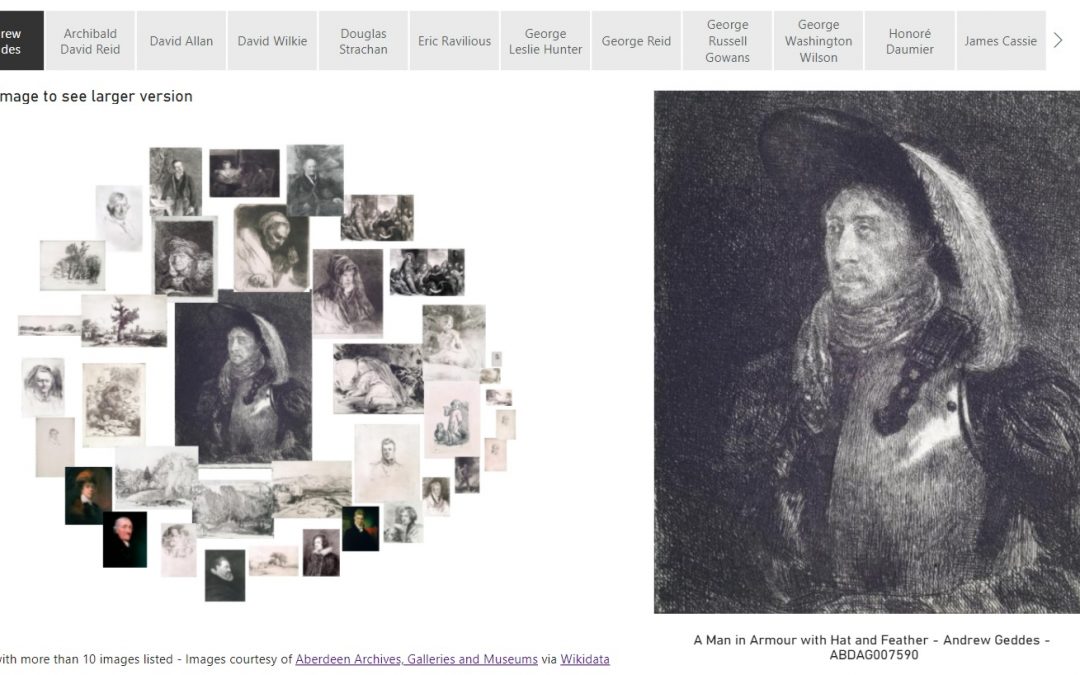
#worldbookday2022  – I discovered last month that some illustrations for The Frog Prince, a fairy tale by the Brothers Grimm, are held by Aberdeen Archives, Museums and Galleries (AAGM). I came across the artwork whilst taking part in a wiki editathon....
Easy – Plotting items on a map using Power BI

Easy – Plotting items on a map using Power BI

This example shows how easy it is to plot items on a map using Power BI. With a few clicks data can be gathered, a map created, and markers plotted onto the map. Simple! Background The example involves using Open Data to plot monuments in Dundee (UK) onto a map using...

Pin It on Pinterest