
Sep 22, 2022
The follow along R project in the YouTube video below shows how to load a spreadsheet into an R script, manipulate the data by pivoting columns, and then producing a line chart with data points. The spreadsheet used in the project can be found below. The original...

Sep 21, 2022
The follow along R project in the YouTube video below shows how to load a spreadsheet into an R script, manipulate the data by removing column/variable, change variable name, and pivot columns, and then producing a bar chart. The spreadsheet used in the project can be...
Jun 8, 2022
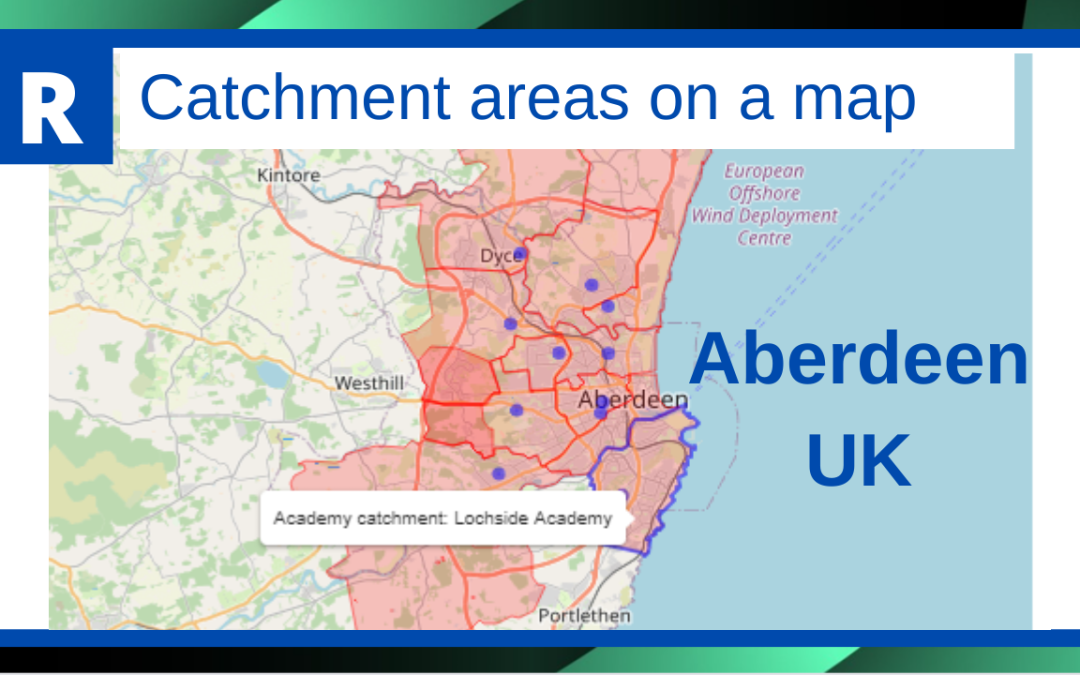
This example using RShiny shows how to add polygons to a map from a geoJSON file to show school catchment areas. The school locations are then plotted. The geoJSON file used in this project can be found at:...

Mar 23, 2022
Automatic Identification System (AIS) data Ahoy there! Did you know that you can track the location of vessels? All you need is the AIS data transmitted by the vessel. AIS data provides a wealth of information including current location, course, and speed all...
Mar 13, 2022
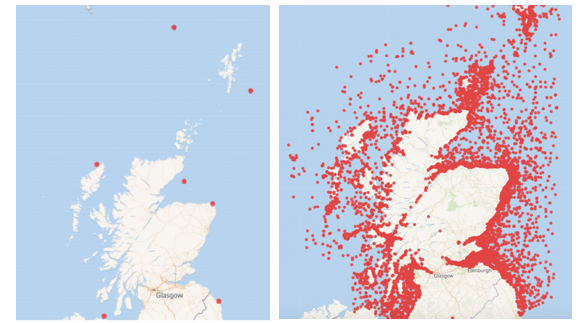
Over 23,000 ships have been wrecked off the coast of Scotland. I was astounded when I discovered that figure as it’s far higher than I would have guessed. I quickly went from being astonished to being quite sombre thinking about how many lives would have been lost at...