RStudio and R
Articles and How to guides
YouTube
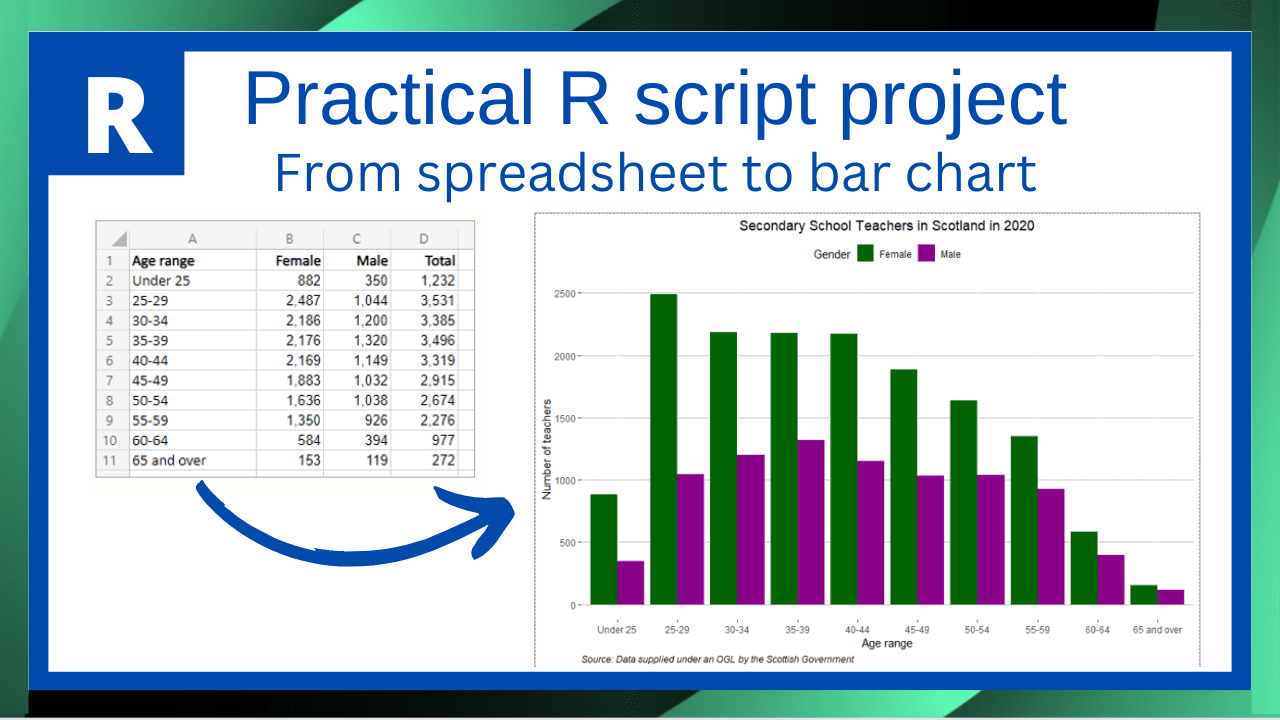
R Project - how to create bar chart (ggplot2) from spreadsheet-includes data pivot & remove a column
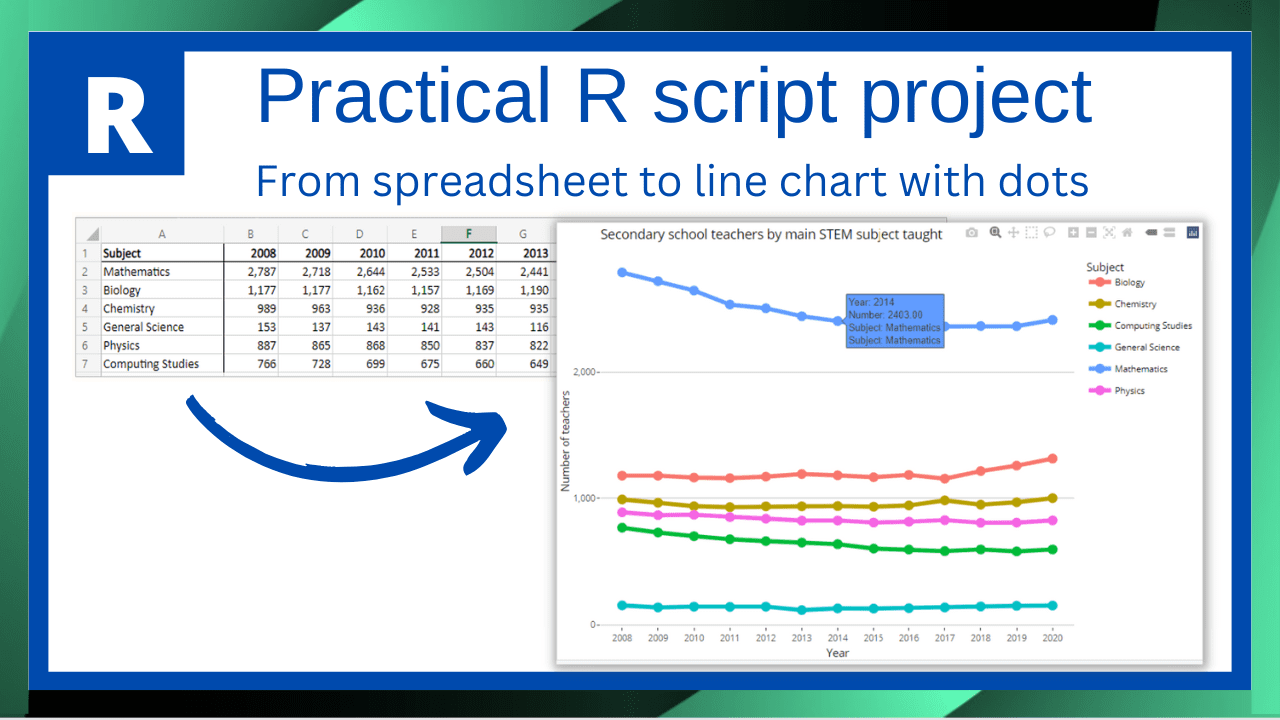
R Project - create line chart with points (ggplot2 & plotly) from spreadsheet-includes data pivot
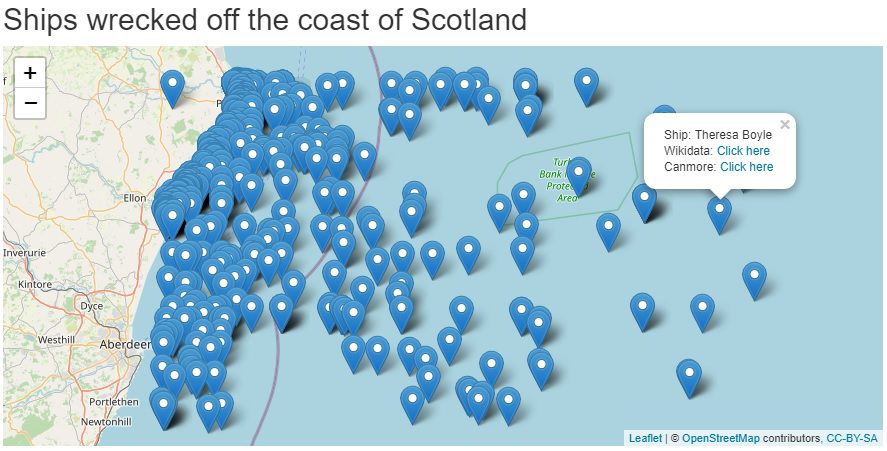
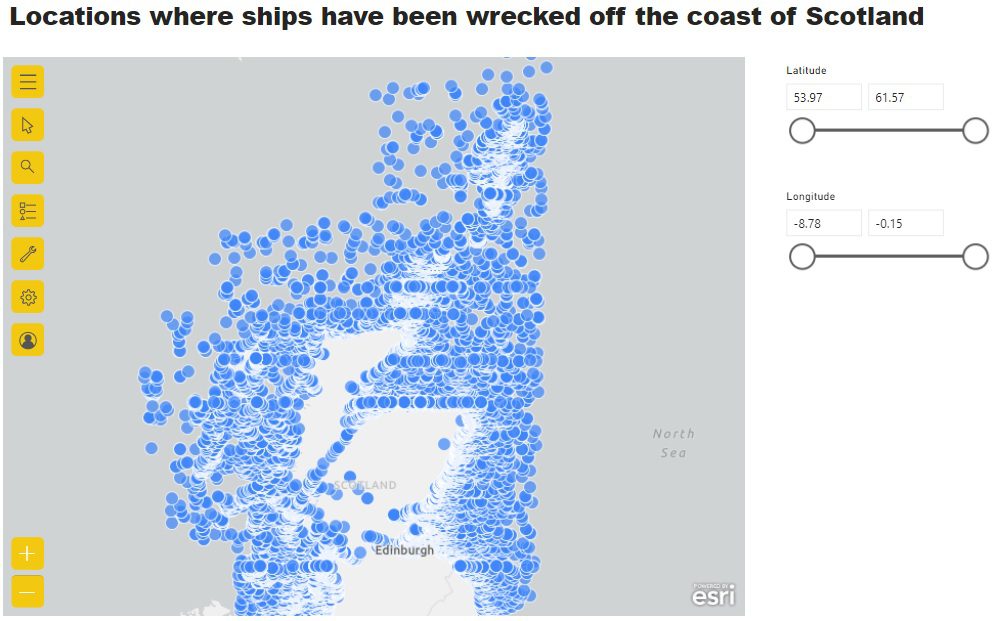
Mapping Wikidata Shipwreck data in an R Shiny App
Map Wikidata in an R Shiny App – example
App created can be viewed here

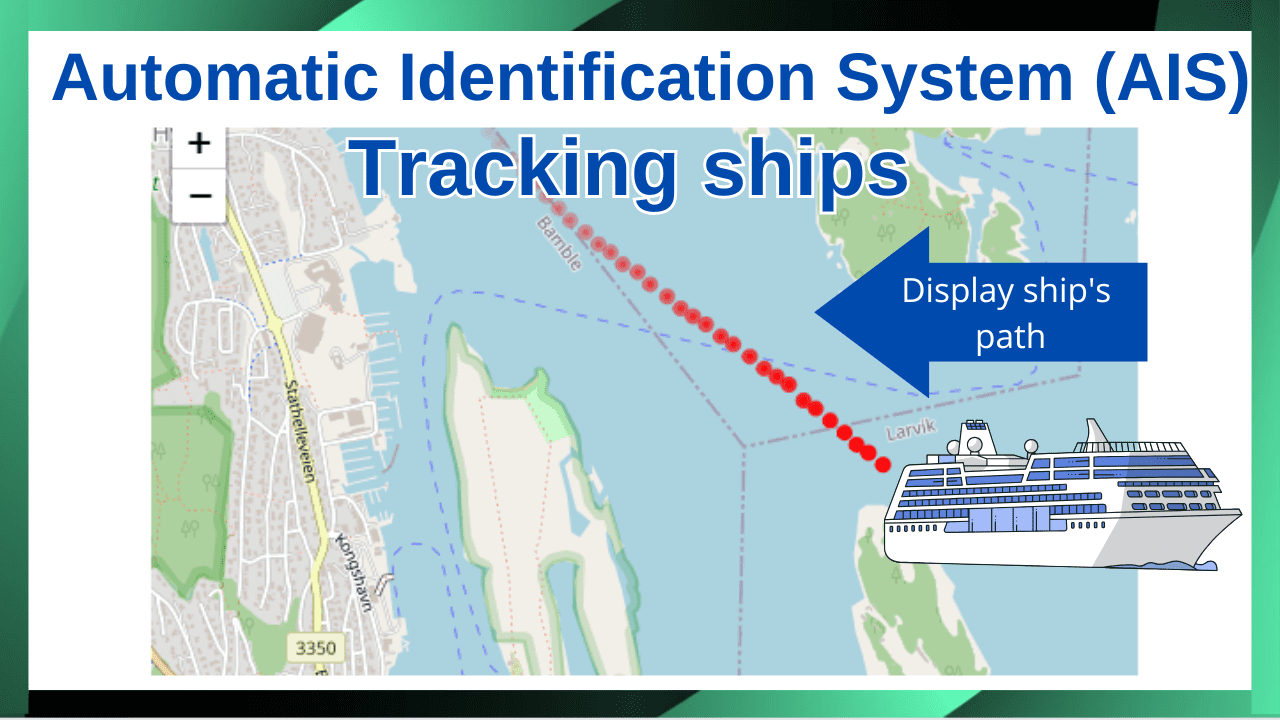
Map direction of ship travel using AIS data in R Shiny app
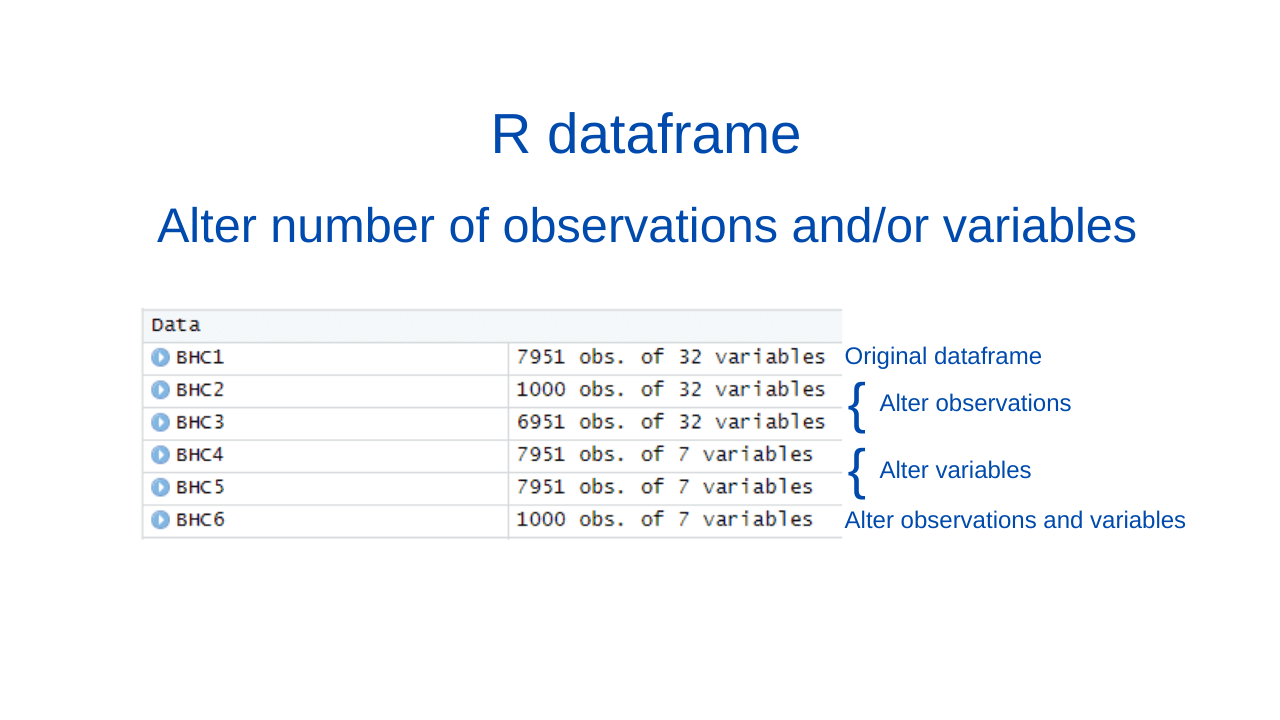
In R dataframe - how to alter the number of observations and/or variables
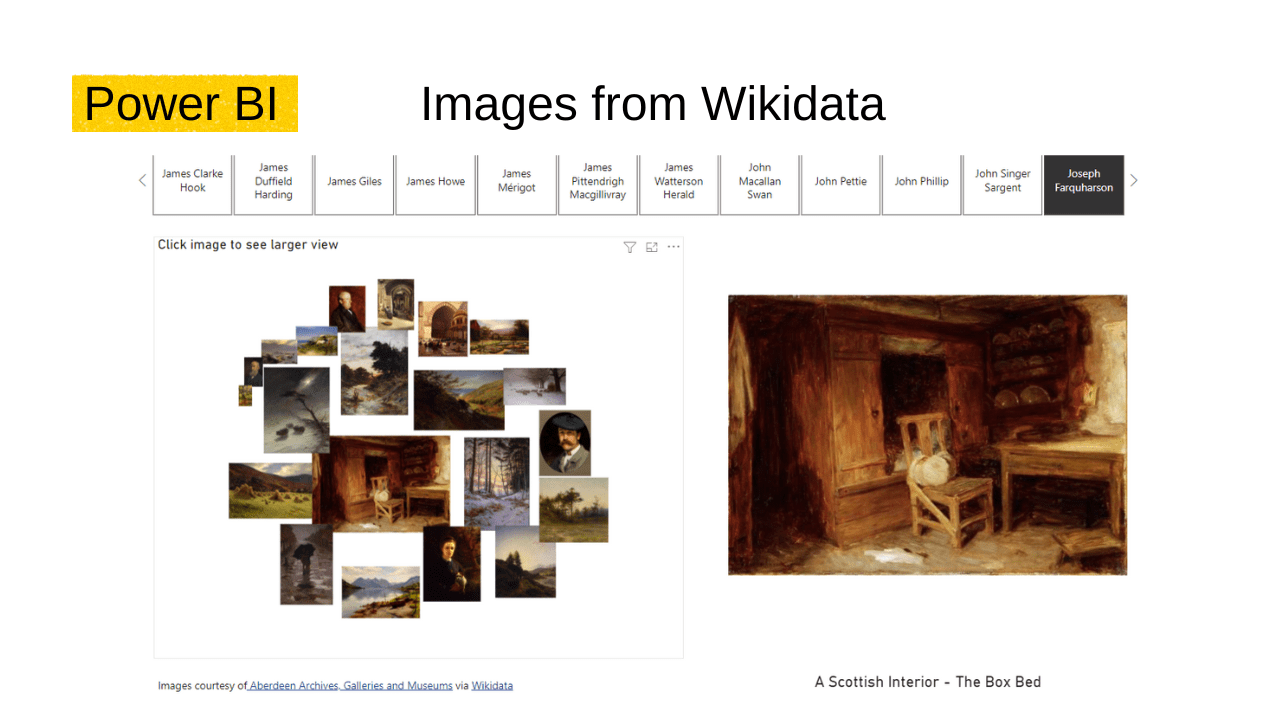
Power BI project - Create image grids - Images from Wikidata brought in using a simple R script
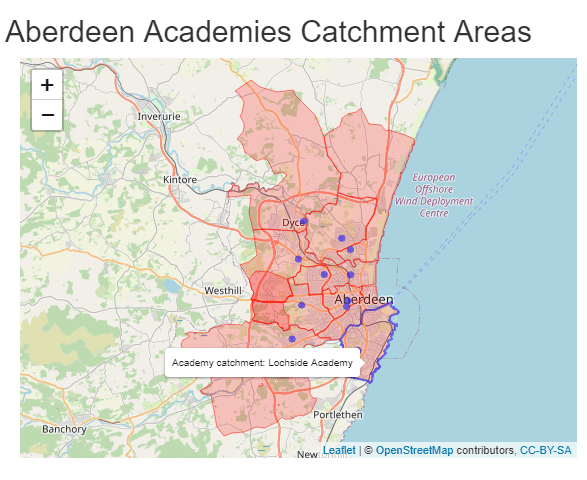
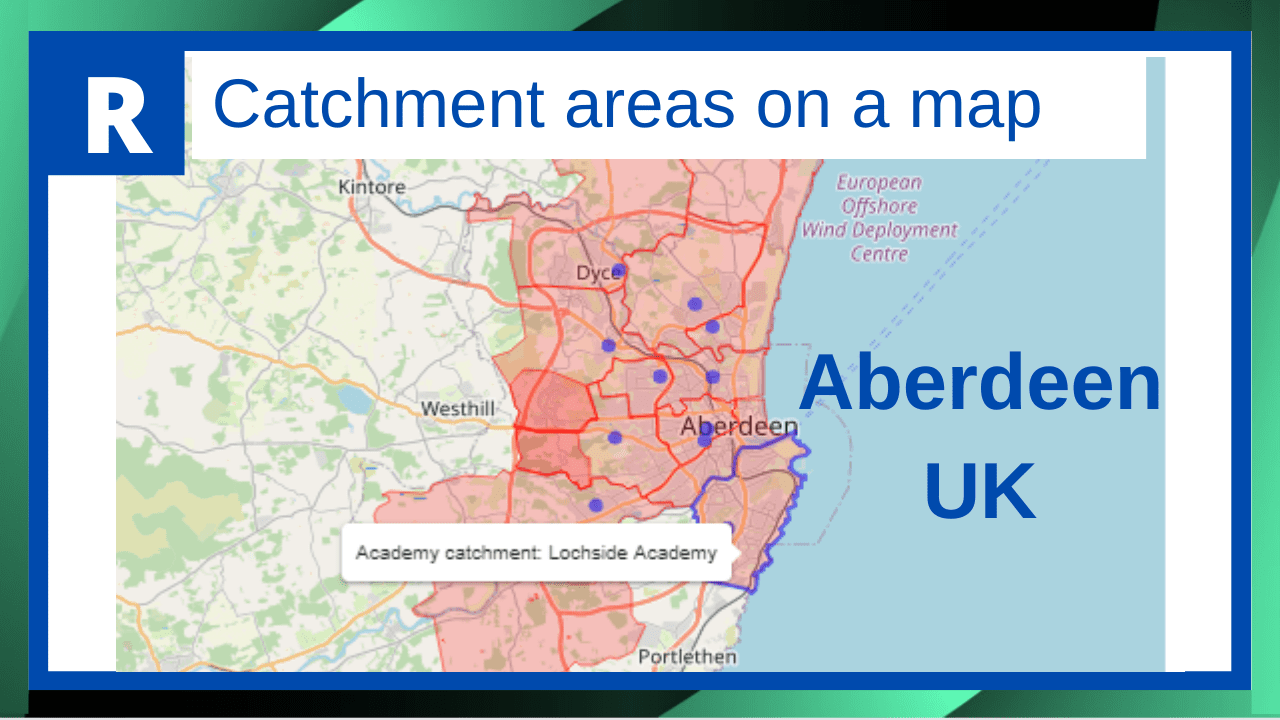
Add schools and their catchment areas to a map using a geoJson file
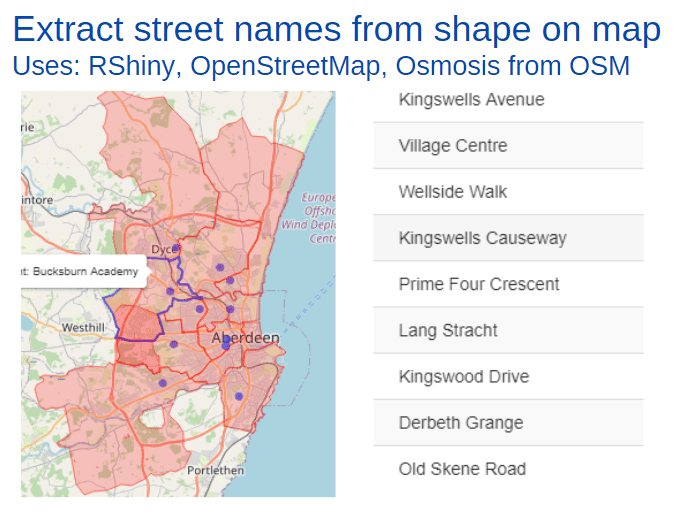
Extract street names from a shape using OpenStreetMap tools and RShiny
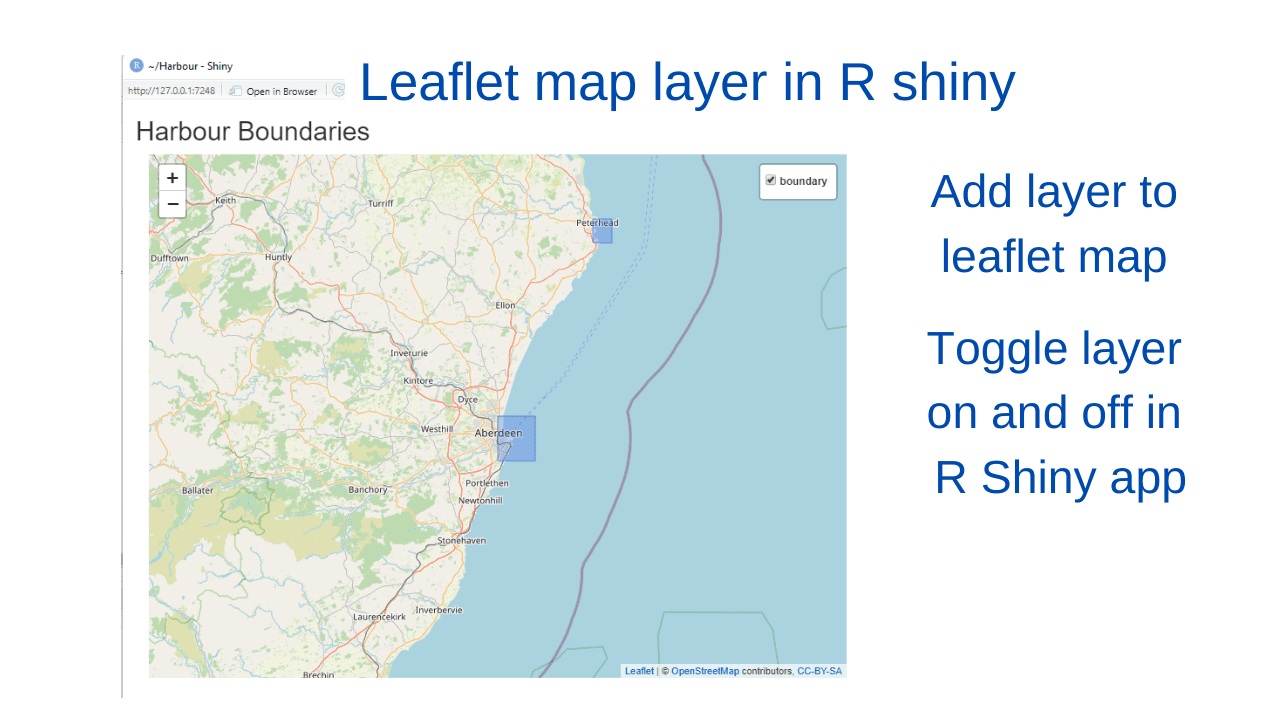
In R Shiny create leaflet map, add layer of rectangle shapes, toggle layer on and off - example
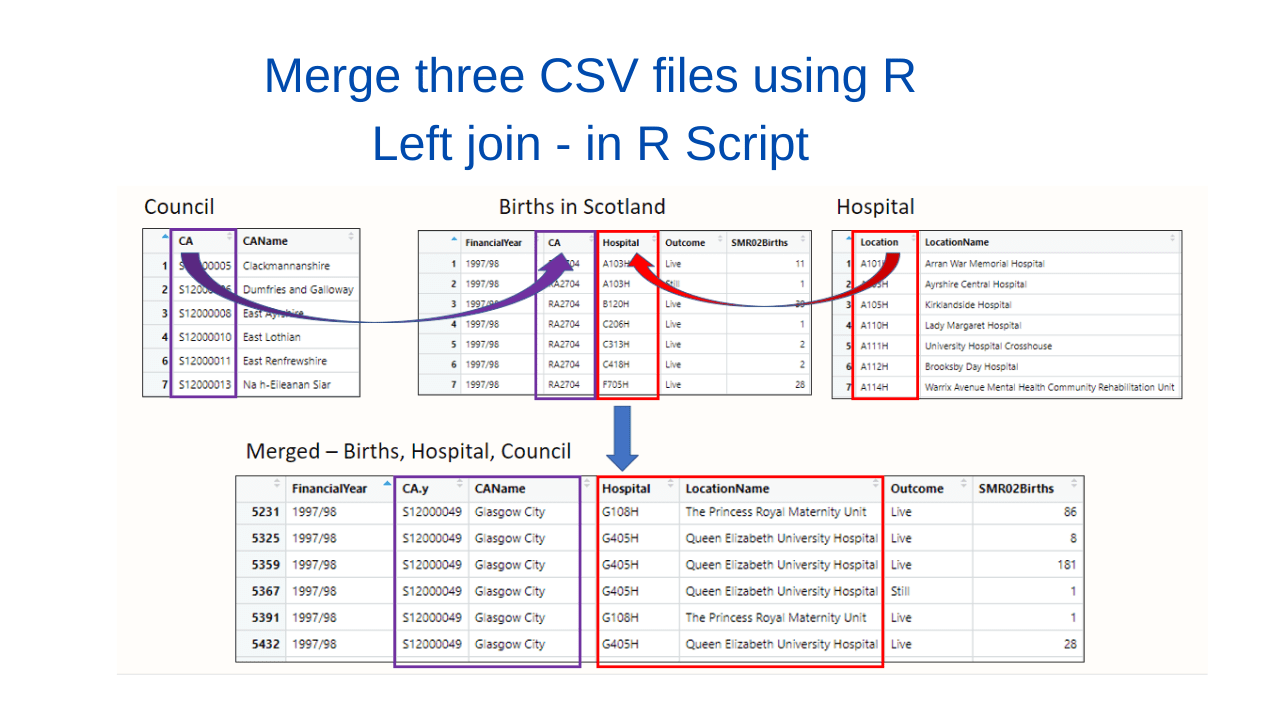
Using R code, merge 3 csv files using left joins in an R Script - follow along using open data
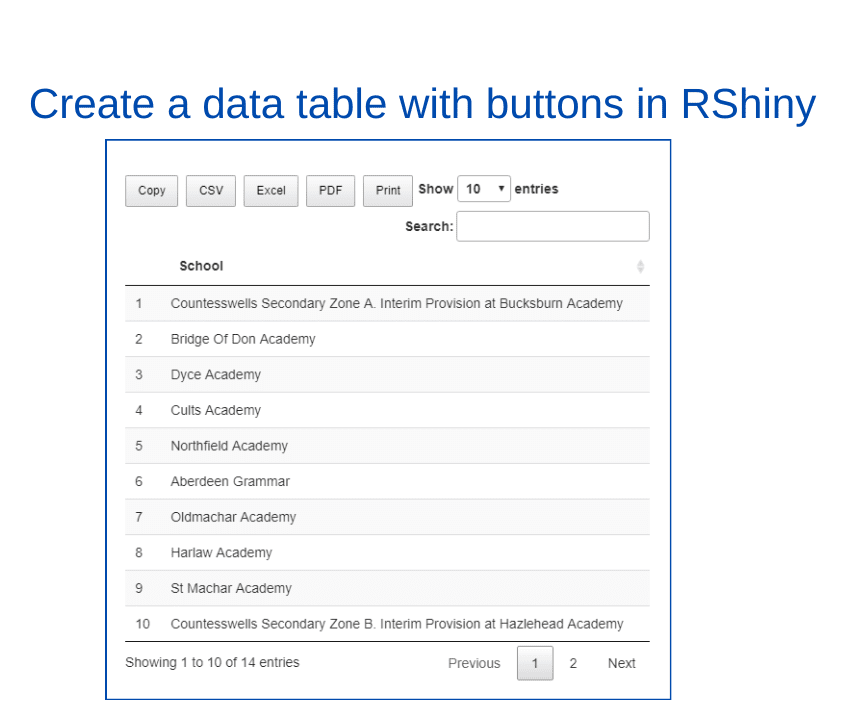
RShiny - Create a table from data extracted from a geoJSON file and add buttons to allow user to download or copy the contents of the table