Maps
Articles and How to guides
YouTube
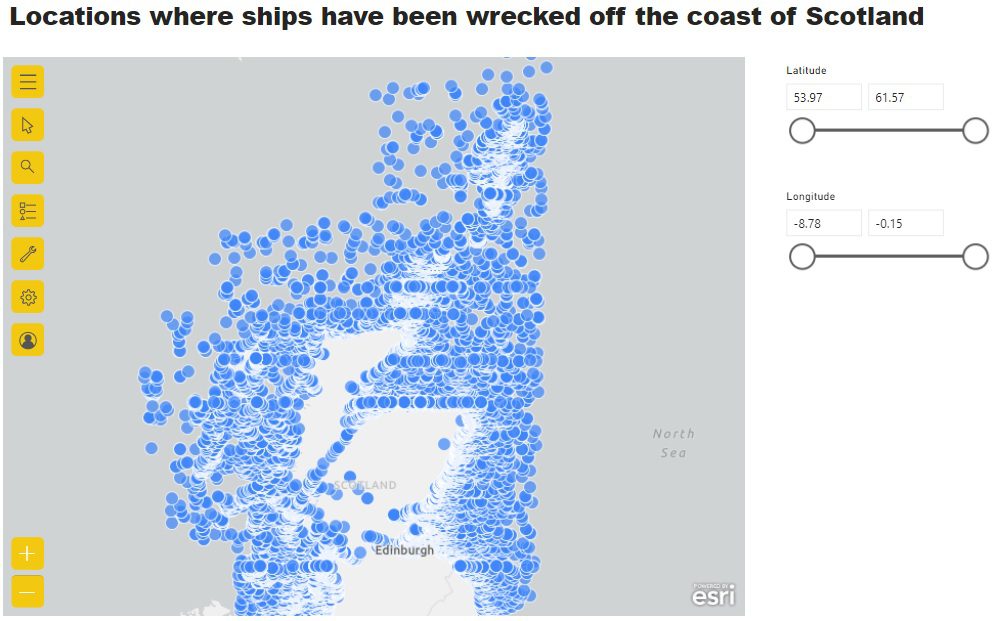
Mapping Wikidata Shipwreck data in Power BI
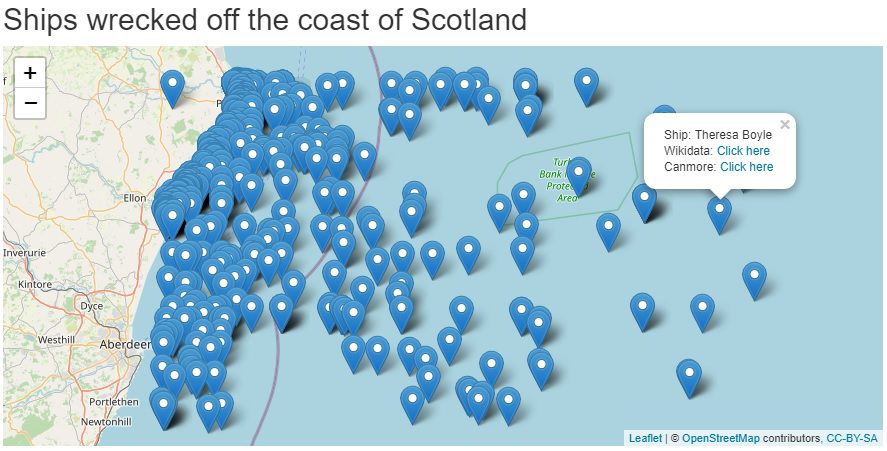
Mapping Wikidata Shipwreck data in an R Shiny App

Map direction of ship travel using AIS data in R Shiny app
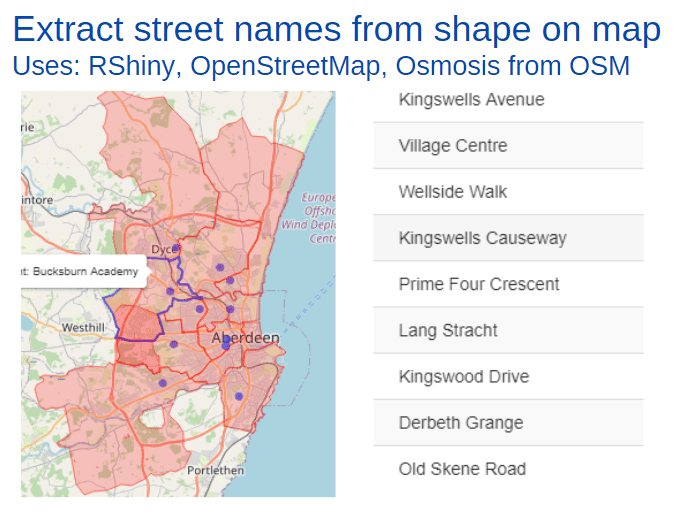
RShiny project - Plot polygons from GeoJSON file to leaflet map and plot circles from excel file
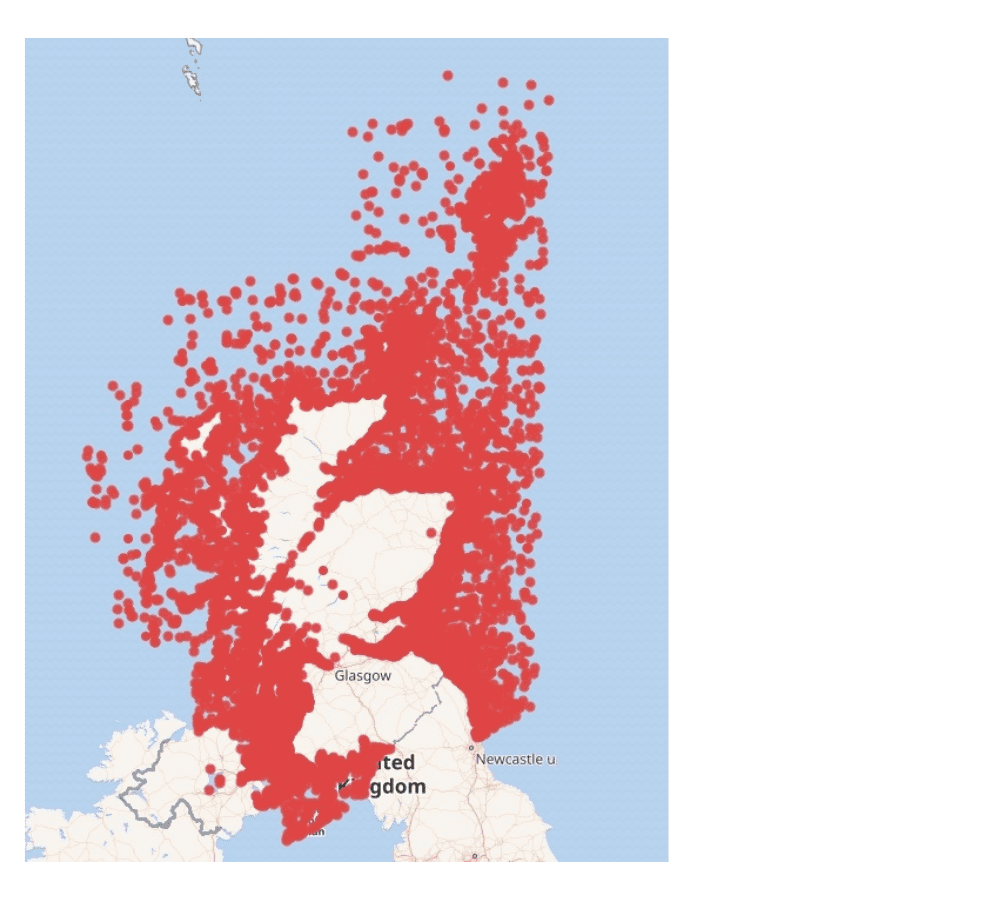
Mapping Shipwreck data in Wikidata
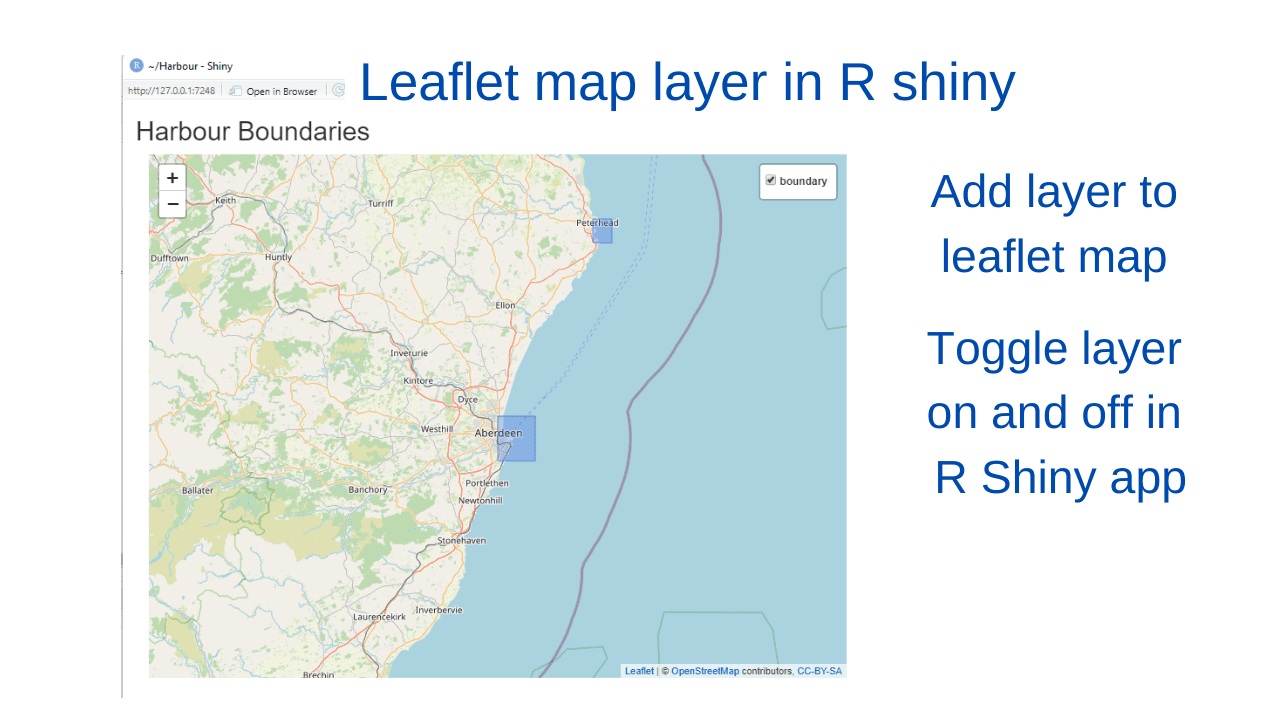
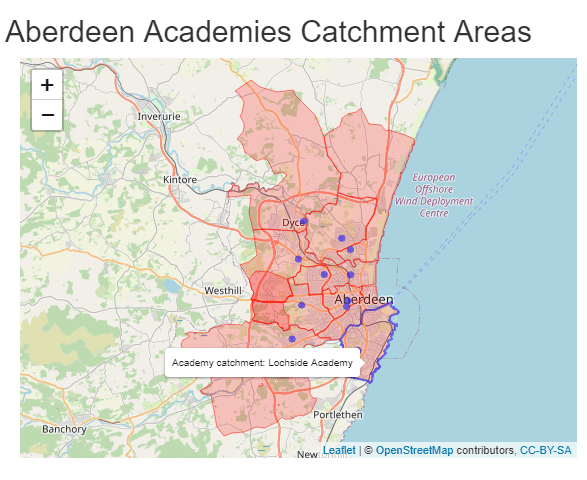
In R Shiny create a layer on a map which can be toggled off and on